
Uncategorized
What Is Air Quality Index? Your Health Guide

May
TL;DR:
- The air quality index (AQI) ranges from 0 to 500, with higher numbers indicating worse air and increased health risks. The AQI is determined by the highest concentration among regulated pollutants, warning sensitive groups to take precautions during elevated levels; indoor air quality, however, can differ substantially from outdoor measurements. Recognizing the limitations of geographic and temporal granularity, individuals should monitor trends, rely on official sources, and improve indoor air safety through quality air purifiers.
Every time you step outside, the air around you carries a mix of invisible pollutants that can affect your lungs, heart, and overall health. The air quality index gives you a single number that tells you exactly how risky that air is to breathe. Most people glance at that number on a weather app without really understanding what it means. This article breaks down what the air quality index is, how it’s calculated, what pollutants drive it, and what you should actually do based on the number you see.
Table of Contents
- Key takeaways
- What is air quality index and how the scale works
- Pollutants that drive the AQI number
- How AQI levels affect your health and behavior
- Limitations and nuances you should know
- My honest take on what most people get wrong about AQI
- Take control of your indoor air quality
- FAQ
Key takeaways
| Point | Details |
|---|---|
| AQI scale from 0 to 500 | The higher the number, the worse the air and the greater the health risk. |
| Six color-coded categories | Each category carries specific health guidance for the general public and sensitive groups. |
| Worst pollutant sets the score | The single most dangerous pollutant at any moment determines the overall AQI value. |
| Sensitive groups face greater risk | Children, elderly adults, and people with asthma are affected at lower AQI levels than healthy adults. |
| AQI reflects short-term exposure | Daily readings help with immediate decisions but do not capture long-term cumulative pollution risk. |
What is air quality index and how the scale works
The air quality index is a standardized scale from 0 to 500 that translates complex pollution data into a single number representing the level of health risk in the air on any given day. The U.S. Environmental Protection Agency developed it so that the general public, not just scientists, could understand whether the air is safe to breathe.
The scale is divided into six categories, each with a color code:
| AQI Range | Category | Color | Health Meaning |
|---|---|---|---|
| 0–50 | Good | Green | Air quality is satisfactory with little to no risk. |
| 51–100 | Moderate | Yellow | Acceptable air quality; some pollutants may affect very sensitive individuals. |
| 101–150 | Unhealthy for Sensitive Groups | Orange | Sensitive groups may experience health effects; general public is less likely affected. |
| 151–200 | Unhealthy | Red | Everyone may begin to experience health effects; sensitive groups face more serious risks. |
| 201–300 | Very Unhealthy | Purple | Health alert for the entire population; serious effects more likely. |
| 301–500 | Hazardous | Maroon | Emergency conditions; the entire population is at risk. |
One concept that surprises most people is the “worst pollutant wins” principle. When the EPA calculates the AQI for a given location, it measures each regulated pollutant separately and assigns each a sub-index score. The final AQI you see is not an average. It is the highest individual sub-index. If ozone is at a 90 and PM2.5 is at a 130, your AQI for the day is 130. This design is intentional. It means the reported number always reflects the greatest health threat present in the air, not a diluted average of multiple pollutants.
Pro Tip: When checking air quality today, look beyond the number itself. Tap into the details to see which specific pollutant is driving the AQI. That tells you whether to be more concerned about respiratory effects from ozone or particulate matter.
Pollutants that drive the AQI number
Understanding how air quality is measured starts with knowing what gets measured. The AQI is based on five pollutants regulated under the Clean Air Act: ground-level ozone, particulate matter (split into PM2.5 and PM10), carbon monoxide, sulfur dioxide, and nitrogen dioxide.
| Pollutant | Primary Source | Main Health Effect |
|---|---|---|
| Ground-level ozone | Vehicle exhaust reacting with sunlight | Irritates lungs, worsens asthma |
| PM2.5 | Combustion, wildfires, industry | Penetrates deep into lungs and bloodstream |
| PM10 | Dust, pollen, construction | Irritates nose and throat |
| Carbon monoxide | Incomplete fuel combustion | Reduces oxygen delivery in the blood |
| Sulfur dioxide | Coal burning, smelting | Triggers respiratory distress |
| Nitrogen dioxide | Vehicle and power plant emissions | Inflames airways, increases infection risk |
PM2.5 is the one most closely linked to serious long-term cardiovascular and respiratory disease. The “2.5” refers to particle diameter in micrometers. These particles are about 30 times smaller than a human hair, which allows them to bypass your body’s natural filtering systems and enter the bloodstream directly.
Each pollutant has a national air quality standard, and an AQI of 100 corresponds to that standard. Any reading above 100 means the pollutant level exceeds what is considered safe for sensitive groups. Above 150, it exceeds safe levels for the general public.
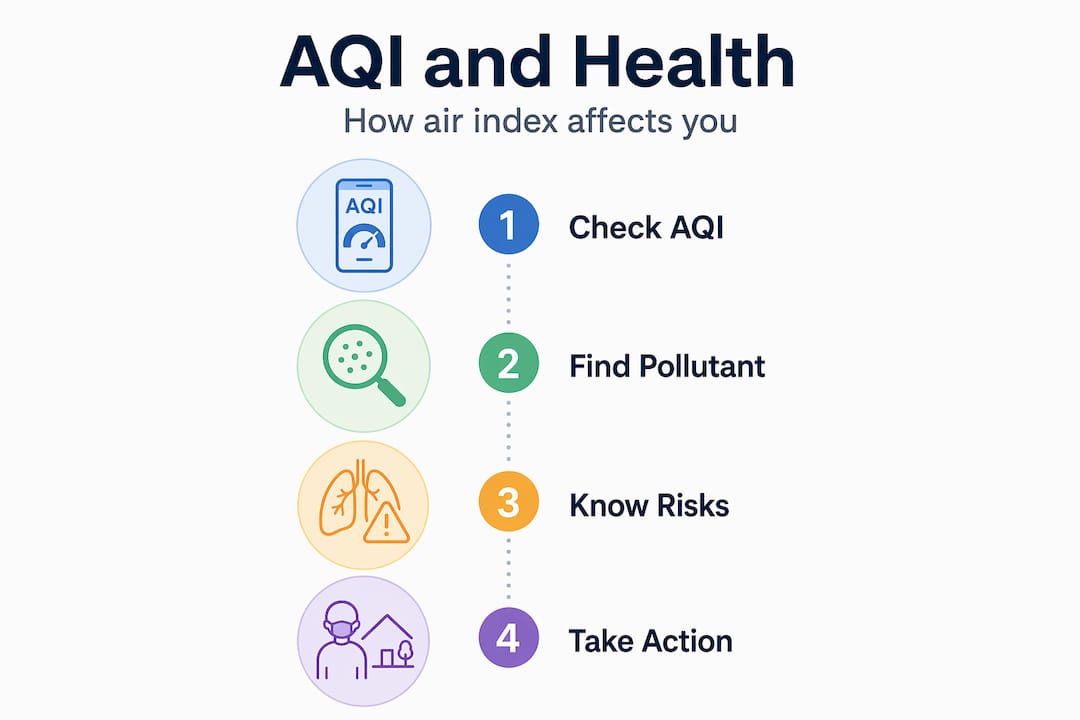
It’s also worth knowing that consumer-grade air quality monitors measure trends rather than precise pollutant concentrations. Regulatory monitors use sophisticated techniques like beta attenuation and oscillating microbalances. Your personal air quality device at home uses optical sensors that are far less accurate. This doesn’t make them useless, but you should treat their readings as directional indicators rather than official AQI numbers.
Pro Tip: For official AQI readings, use government sources like AirNow.gov rather than relying solely on consumer apps or personal monitors, especially before making decisions about outdoor activity for children or elderly family members.
How AQI levels affect your health and behavior
The importance of air quality index goes far beyond a color on your screen. It directly maps to specific health effects and behavioral recommendations that differ based on who you are and what you’re doing.

AQI categories carry tailored health guidance for both the general population and sensitive groups. Sensitive groups include children, older adults, people with asthma or chronic obstructive pulmonary disease, and anyone with cardiovascular conditions. These individuals experience health effects at lower AQI levels than a healthy adult in their 30s.
Here is a practical breakdown of what each level means for you:
- AQI 0–50 (Good): No action needed. Spend as much time outdoors as you want.
- AQI 51–100 (Moderate): Unusually sensitive individuals should consider reducing prolonged outdoor exertion. Most people are fine.
- AQI 101–150 (Unhealthy for Sensitive Groups): Sensitive groups should reduce outdoor activity, especially strenuous exercise. Children should play inside during peak hours.
- AQI 151–200 (Unhealthy): Everyone should limit prolonged outdoor exertion. Sensitive groups should avoid outdoor activity entirely. Keep windows closed.
- AQI 201–300 (Very Unhealthy): All outdoor physical activity should be curtailed. Run air purifiers indoors and use high-quality masks if you must go outside.
- AQI above 301 (Hazardous): Stay indoors with air filtration running. Health authorities issue formal advisories. This is not a suggestion. It’s a public health emergency.
Short-term exposure during a high-AQI day can trigger immediate symptoms: coughing, eye irritation, tightness in the chest, and aggravated asthma. These symptoms often resolve when the air improves. The more serious concern is repeated exposure over weeks and months, which contributes to chronic lung disease, heart disease, and reduced life expectancy.
Real-world examples make this concrete. During wildfire seasons in California and Washington, AQI readings regularly hit the 300s and 400s across entire metro areas. Schools close, outdoor events are canceled, and hospitals see spikes in emergency room visits for respiratory complaints. Entire cities adapt their daily behavior around a single number.
Pro Tip: When AQI hits 150 or above, bringing outdoor air inside through open windows actually makes your indoor air worse. Close everything up and run an air purifier with a HEPA filter instead.
Limitations and nuances you should know
Knowing how air quality is measured is one thing. Knowing where the measurement falls short is equally useful.
The most significant limitation is geographic granularity. Local air quality can vary widely even within a single city. Official monitoring stations are often placed miles apart. If you live near a highway interchange, a bus depot, or an industrial facility, your actual air quality may be significantly worse than the city-wide AQI suggests. The regional number masks these local pollution hot spots.
Another limitation is time scale. AQI captures short-term exposure risk over hours or a single day, not cumulative exposure over years. Someone living in a city with consistently moderate AQI readings may face long-term health risks that a single daily reading never fully communicates. The daily number tells you what to do today. It doesn’t tell you what 20 years of this air will do to your lungs.
Technology is actively improving these limitations. AI-powered spatiotemporal modeling is making air quality forecasting more granular and more accurate by integrating data from dense sensor networks, satellite imagery, and emissions data in real time. By 2026, several cities are piloting neighborhood-level AQI predictions rather than city-wide averages.
A few other important nuances:
- Outdoor AQI does not equal indoor air quality. Indoor pollutants like cooking fumes, cleaning product vapors, mold, and off-gassing materials exist independently of outdoor conditions.
- AQI readings represent hourly or daily averages. A spike in pollution that lasts 30 minutes may not show clearly in a daily average.
- Weather patterns dramatically affect AQI. Wind disperses pollutants. Temperature inversions trap them close to the ground, causing AQI to spike even when pollution sources haven’t changed.
Pro Tip: Cross-reference your outdoor AQI reading with an indoor air quality monitor placed in your home. On days when outdoor AQI is poor, your indoor readings may tell a completely different story depending on your ventilation habits.
Learn more about the differences between indoor and outdoor pollution and how each one affects your household health.
My honest take on what most people get wrong about AQI
I’ve spent years interpreting air quality data, and the biggest mistake I see is treating AQI as a binary signal. People see “Moderate” and assume everything is fine. They see “Unhealthy for Sensitive Groups” and assume it only applies to someone else.
Here’s what I’ve learned. The “worst pollutant wins” model is actually one of the smartest design choices in public health communication. It prevents averaging from hiding danger. A city with clean ozone but catastrophic PM2.5 still gets flagged as dangerous because the highest sub-index wins. Most people don’t realize this protection is built into the number they’re reading.
What genuinely concerns me is the localization problem. I’ve seen areas right next to monitoring stations show completely different readings than streets just a half mile away near industrial zones. Checking the city AQI alone gives you a false sense of security when you live or work near a pollution source.
My practical advice: track AQI trends over a week rather than reacting to a single day’s reading. And invest in your indoor air. Outdoor AQI is largely outside your control. Your indoor environment is not. An air purifier with a true HEPA filter running in your bedroom during a high-pollution stretch does more for your health than any single outdoor behavior change.
— Soldierboy
Take control of your indoor air quality
Understanding AQI is the first step. Acting on it is where health outcomes actually improve. Outdoor air is beyond your control, but your home is not. When AQI spikes, your indoor environment becomes your primary defense.
A quality air purifier with a true HEPA filter removes the fine particulate matter and other pollutants that infiltrate your home even with windows closed. At Cowayswaterpurifier, we’ve put together a detailed air purifier selection guide to help you find the right model for your space and air quality challenges. If you’re looking for the best-rated options available right now, our 2026 health-focused roundup covers the top models worth considering. On days when the AQI is telling you to stay inside, the quality of your indoor air matters more than ever.
FAQ
What does an AQI number actually mean?
The AQI is a scale from 0 to 500 where higher numbers represent worse air quality and greater health risk. Each range maps to a color-coded category with specific health guidance for both the general public and sensitive groups.
How is the air quality index calculated?
The EPA measures concentration levels for five regulated pollutants, converts each into a sub-index score, and reports the highest single sub-index as the final AQI. This “worst pollutant wins” rule ensures the number always reflects the greatest health threat present.
Who is most at risk on high AQI days?
Children, older adults, and people with asthma or heart conditions face health effects at lower AQI levels than healthy adults. Sensitive groups should reduce or avoid outdoor activity starting at AQI 101.
Does AQI measure indoor air quality?
No. AQI reflects outdoor air conditions measured at regulatory monitoring stations. Indoor air quality depends on separate factors including ventilation, cooking, cleaning products, and building materials. The two can differ significantly.
How often does the AQI update?
Official AQI values are typically calculated on an hourly basis and updated throughout the day. Forecasts are also available for the following day based on weather patterns and predicted emissions.
Recommended
- Step-by-Step Guide to Indoor Air Quality Improvement – Coway Water Purifier
- Essential air quality improvement checklist for a healthier home – Coway Water Purifier
- How to Assess Indoor Air Quality Effectively at Home – Coway Water Purifier
- Understanding Why Indoor Air Quality Matters – Coway Water Purifier
